Helping teams make better cost and carbon optimization decisions
________
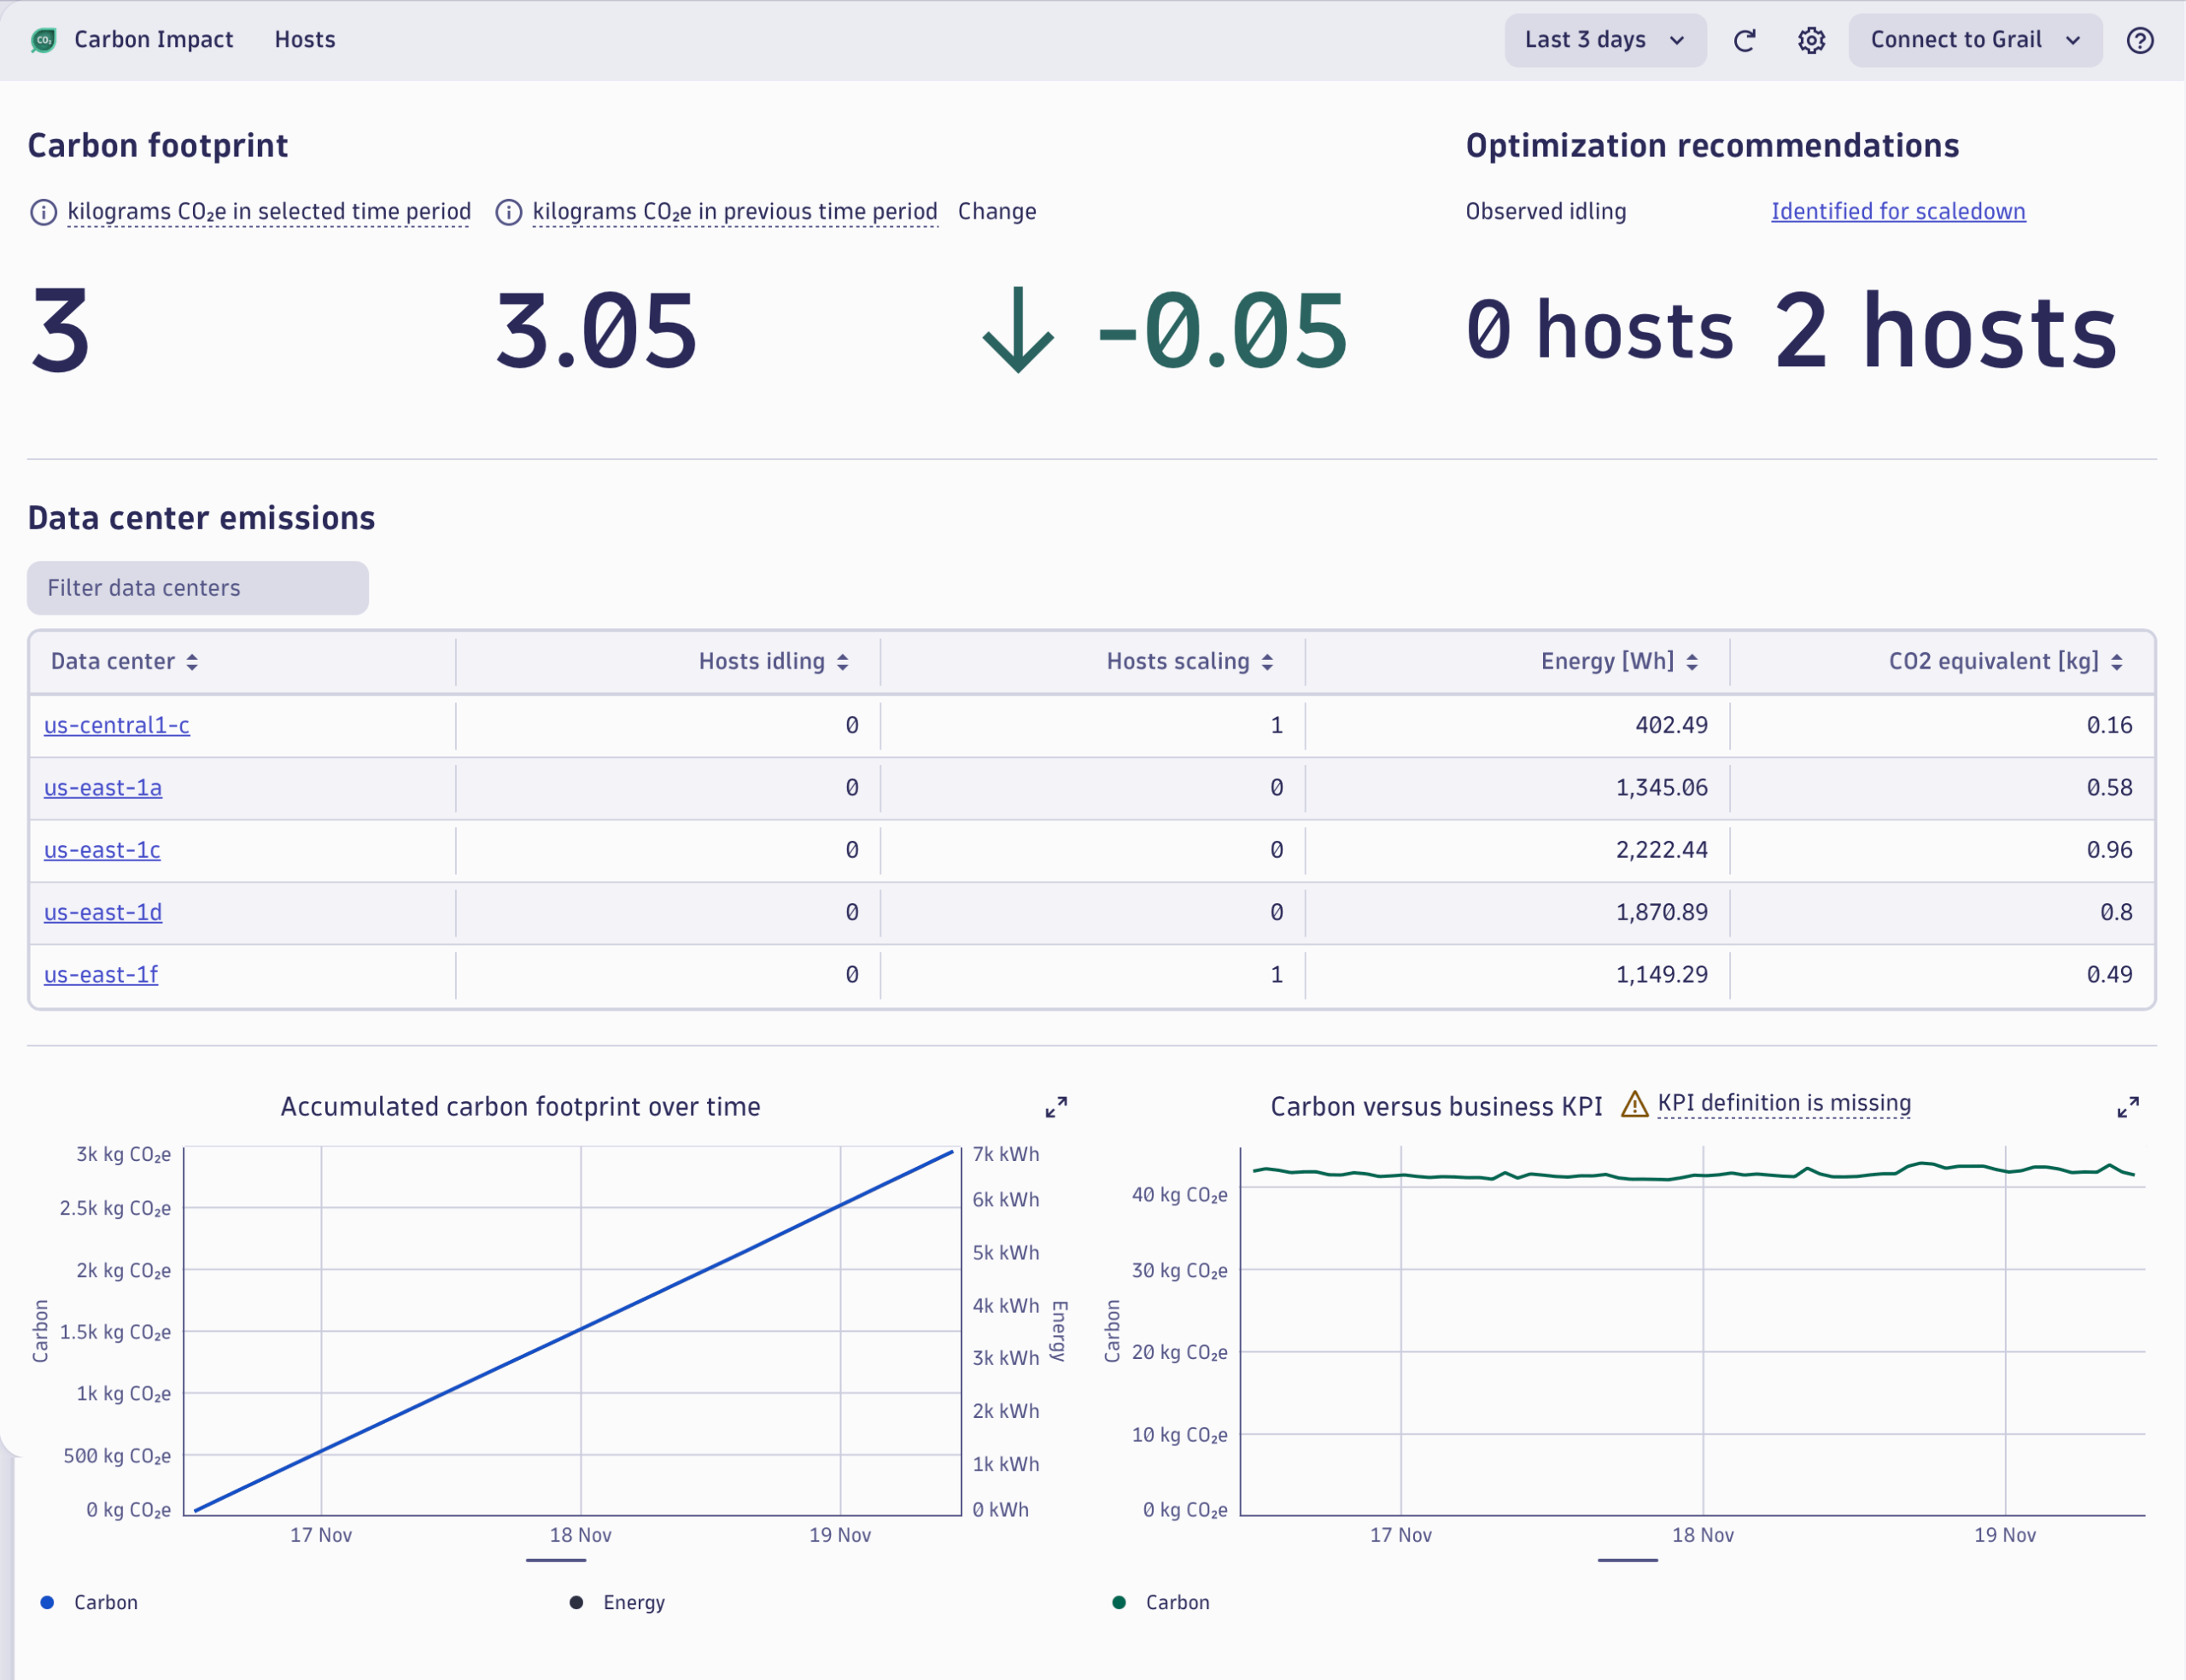
Looking at the past
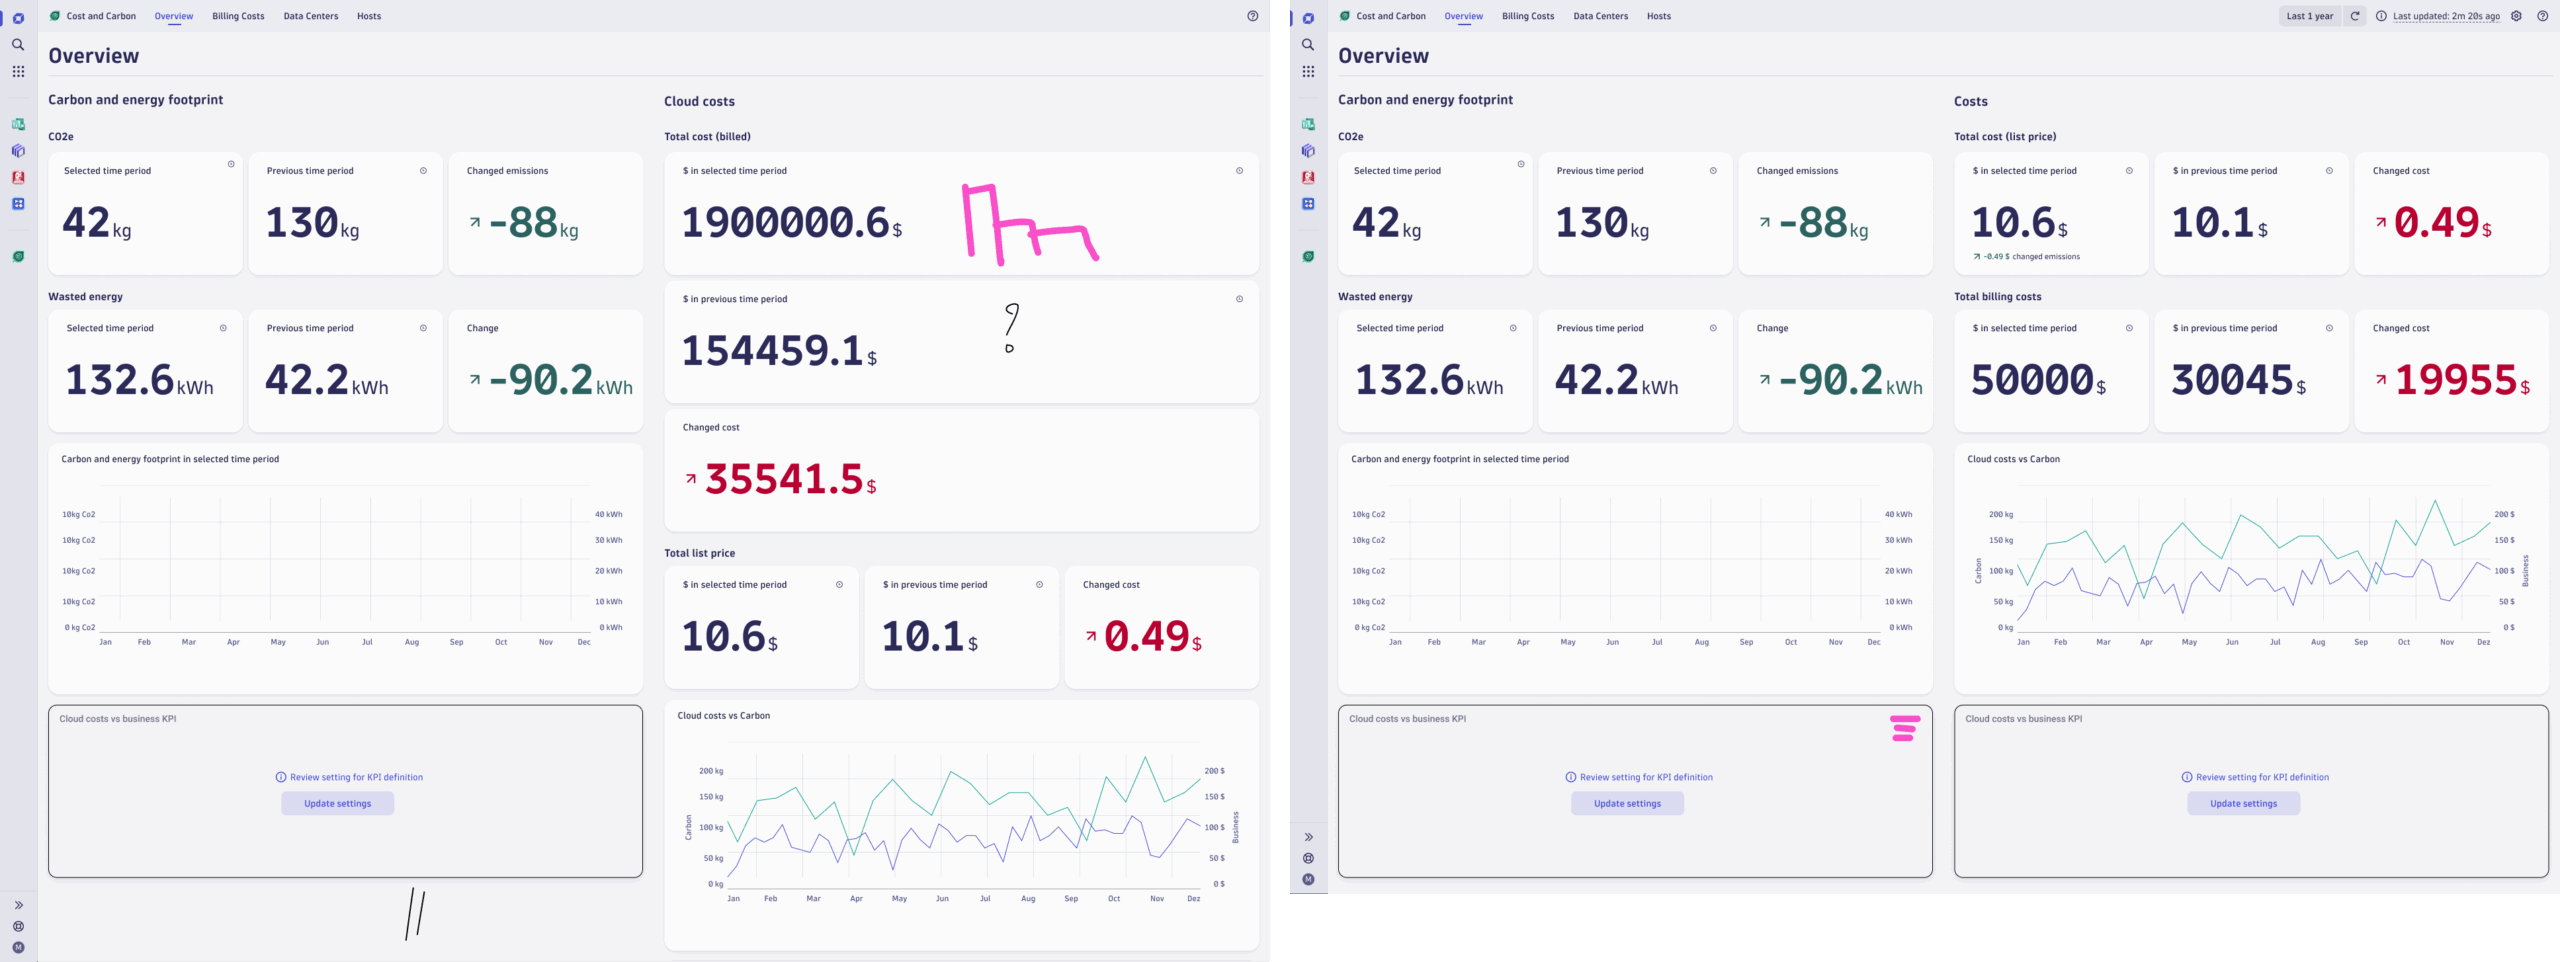
Cost & Carbon Optimization was powerful but visually disjointed built quickly without a designer on the team. An engineering-led experimental build that never got the design love it deserved. When I arrived at Dynatrace, I took over the experience to give the app some clarity and finesse, so the sustainability story lands with our customers. This was my first project @Dynatrace.
The state of the Cost & Carbon app before I arrived.
Why customers care
FinOps and sustainability teams kept telling us the limitations of the current build. It only exposed top-level carbon and cost totals. They needed to drill down to clusters, namespaces, and workloads, correlate carbon with spend $$$, and walk into C-suite conversations with defensible numbers. Without that, they can't prove impact, unlock certifications, and their cost optimization programs fall short.

Understanding the past
The space was brand new for me. I had to break down the existing app into its components, including the logic and calculations used to derive the cost and carbon data, to fully understand it.
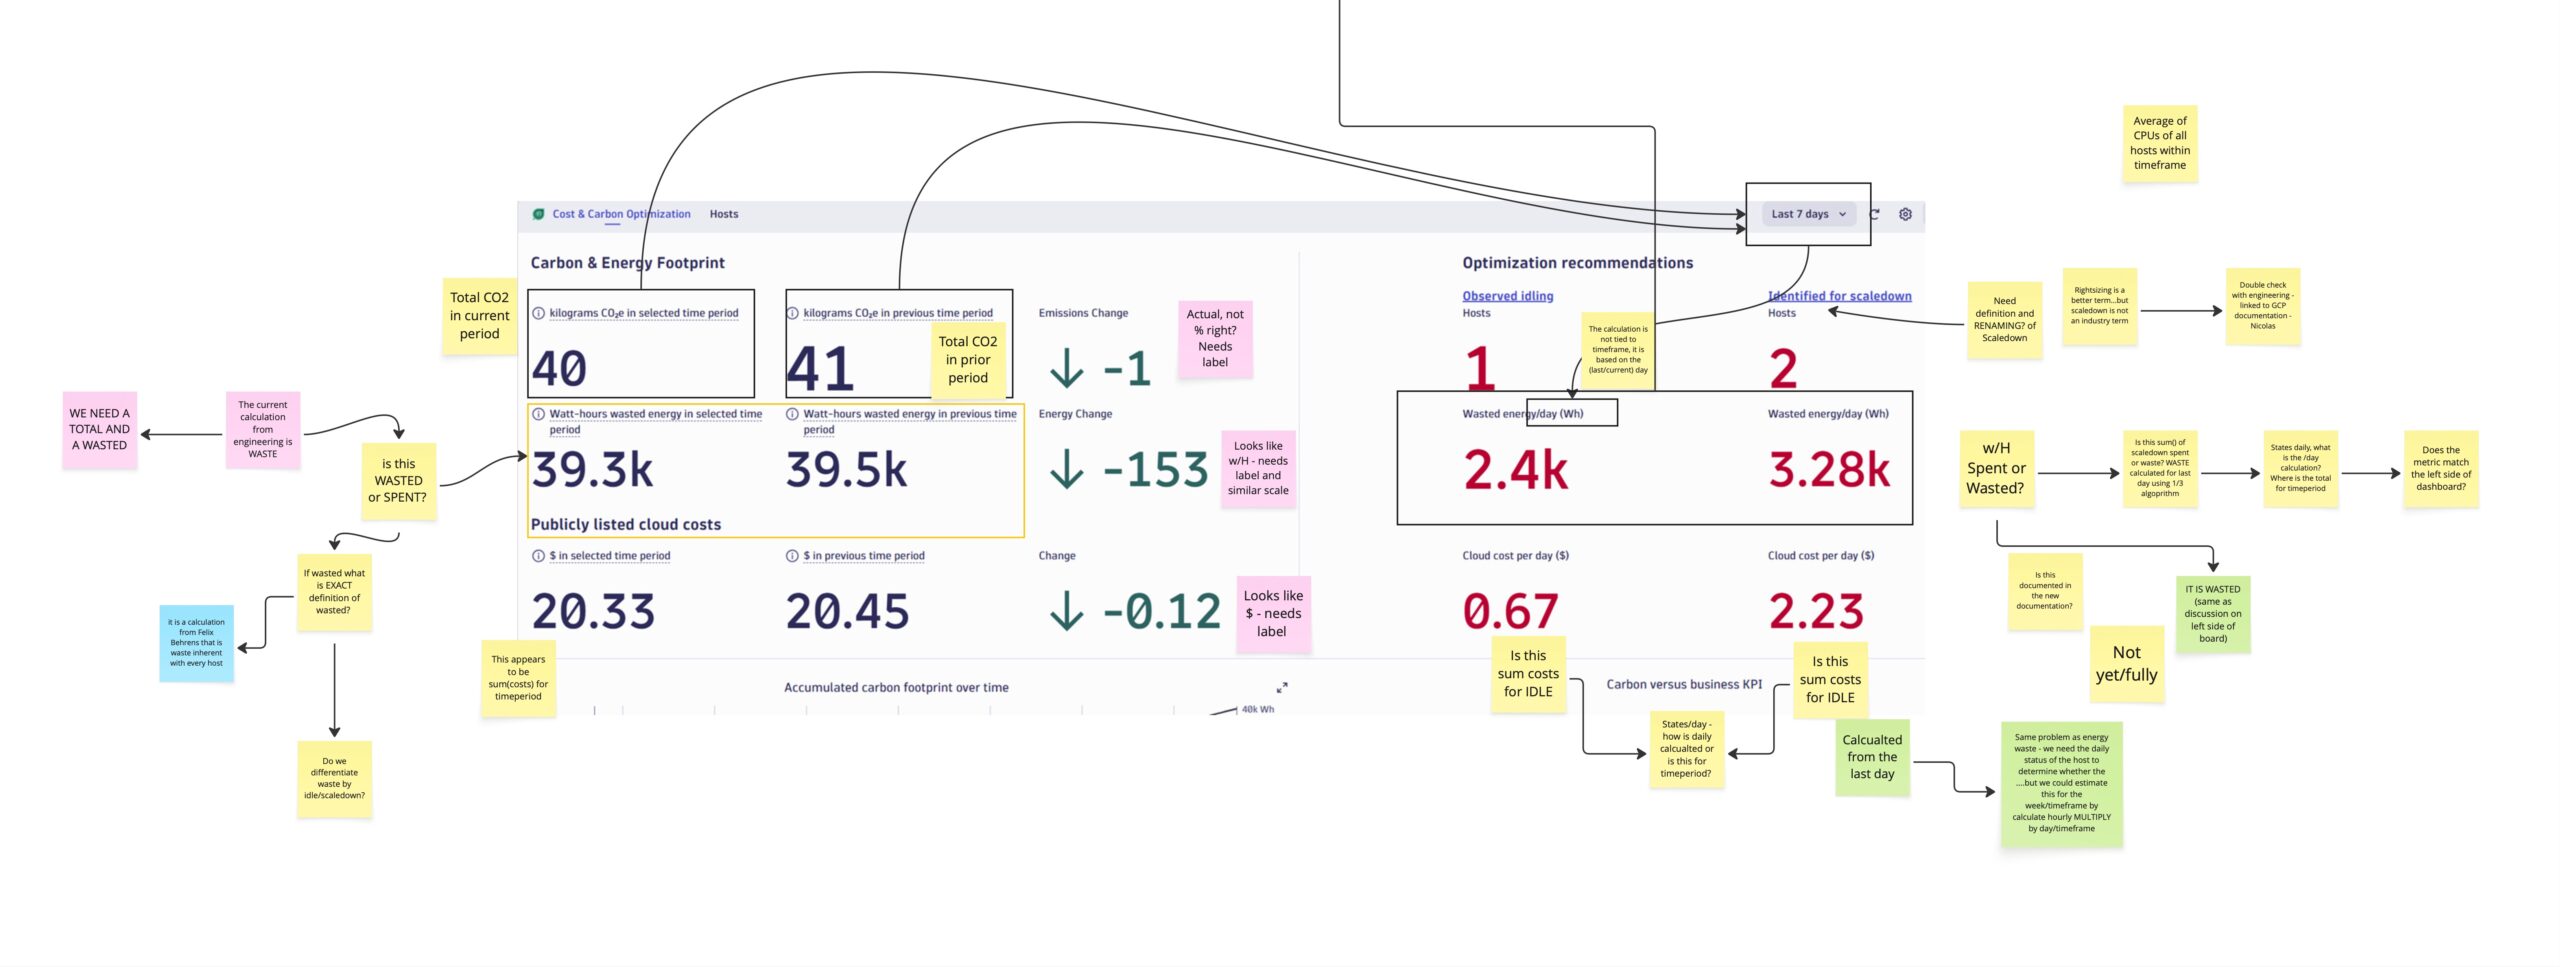
User feedback on existing the product
Customers asked for certified carbon calculations as proof that their sustainability initiatives were working, and a single place to see idle spend, carbon and savings opportunities show up together. They asked for guided actions, not just dashboards.
Our north star
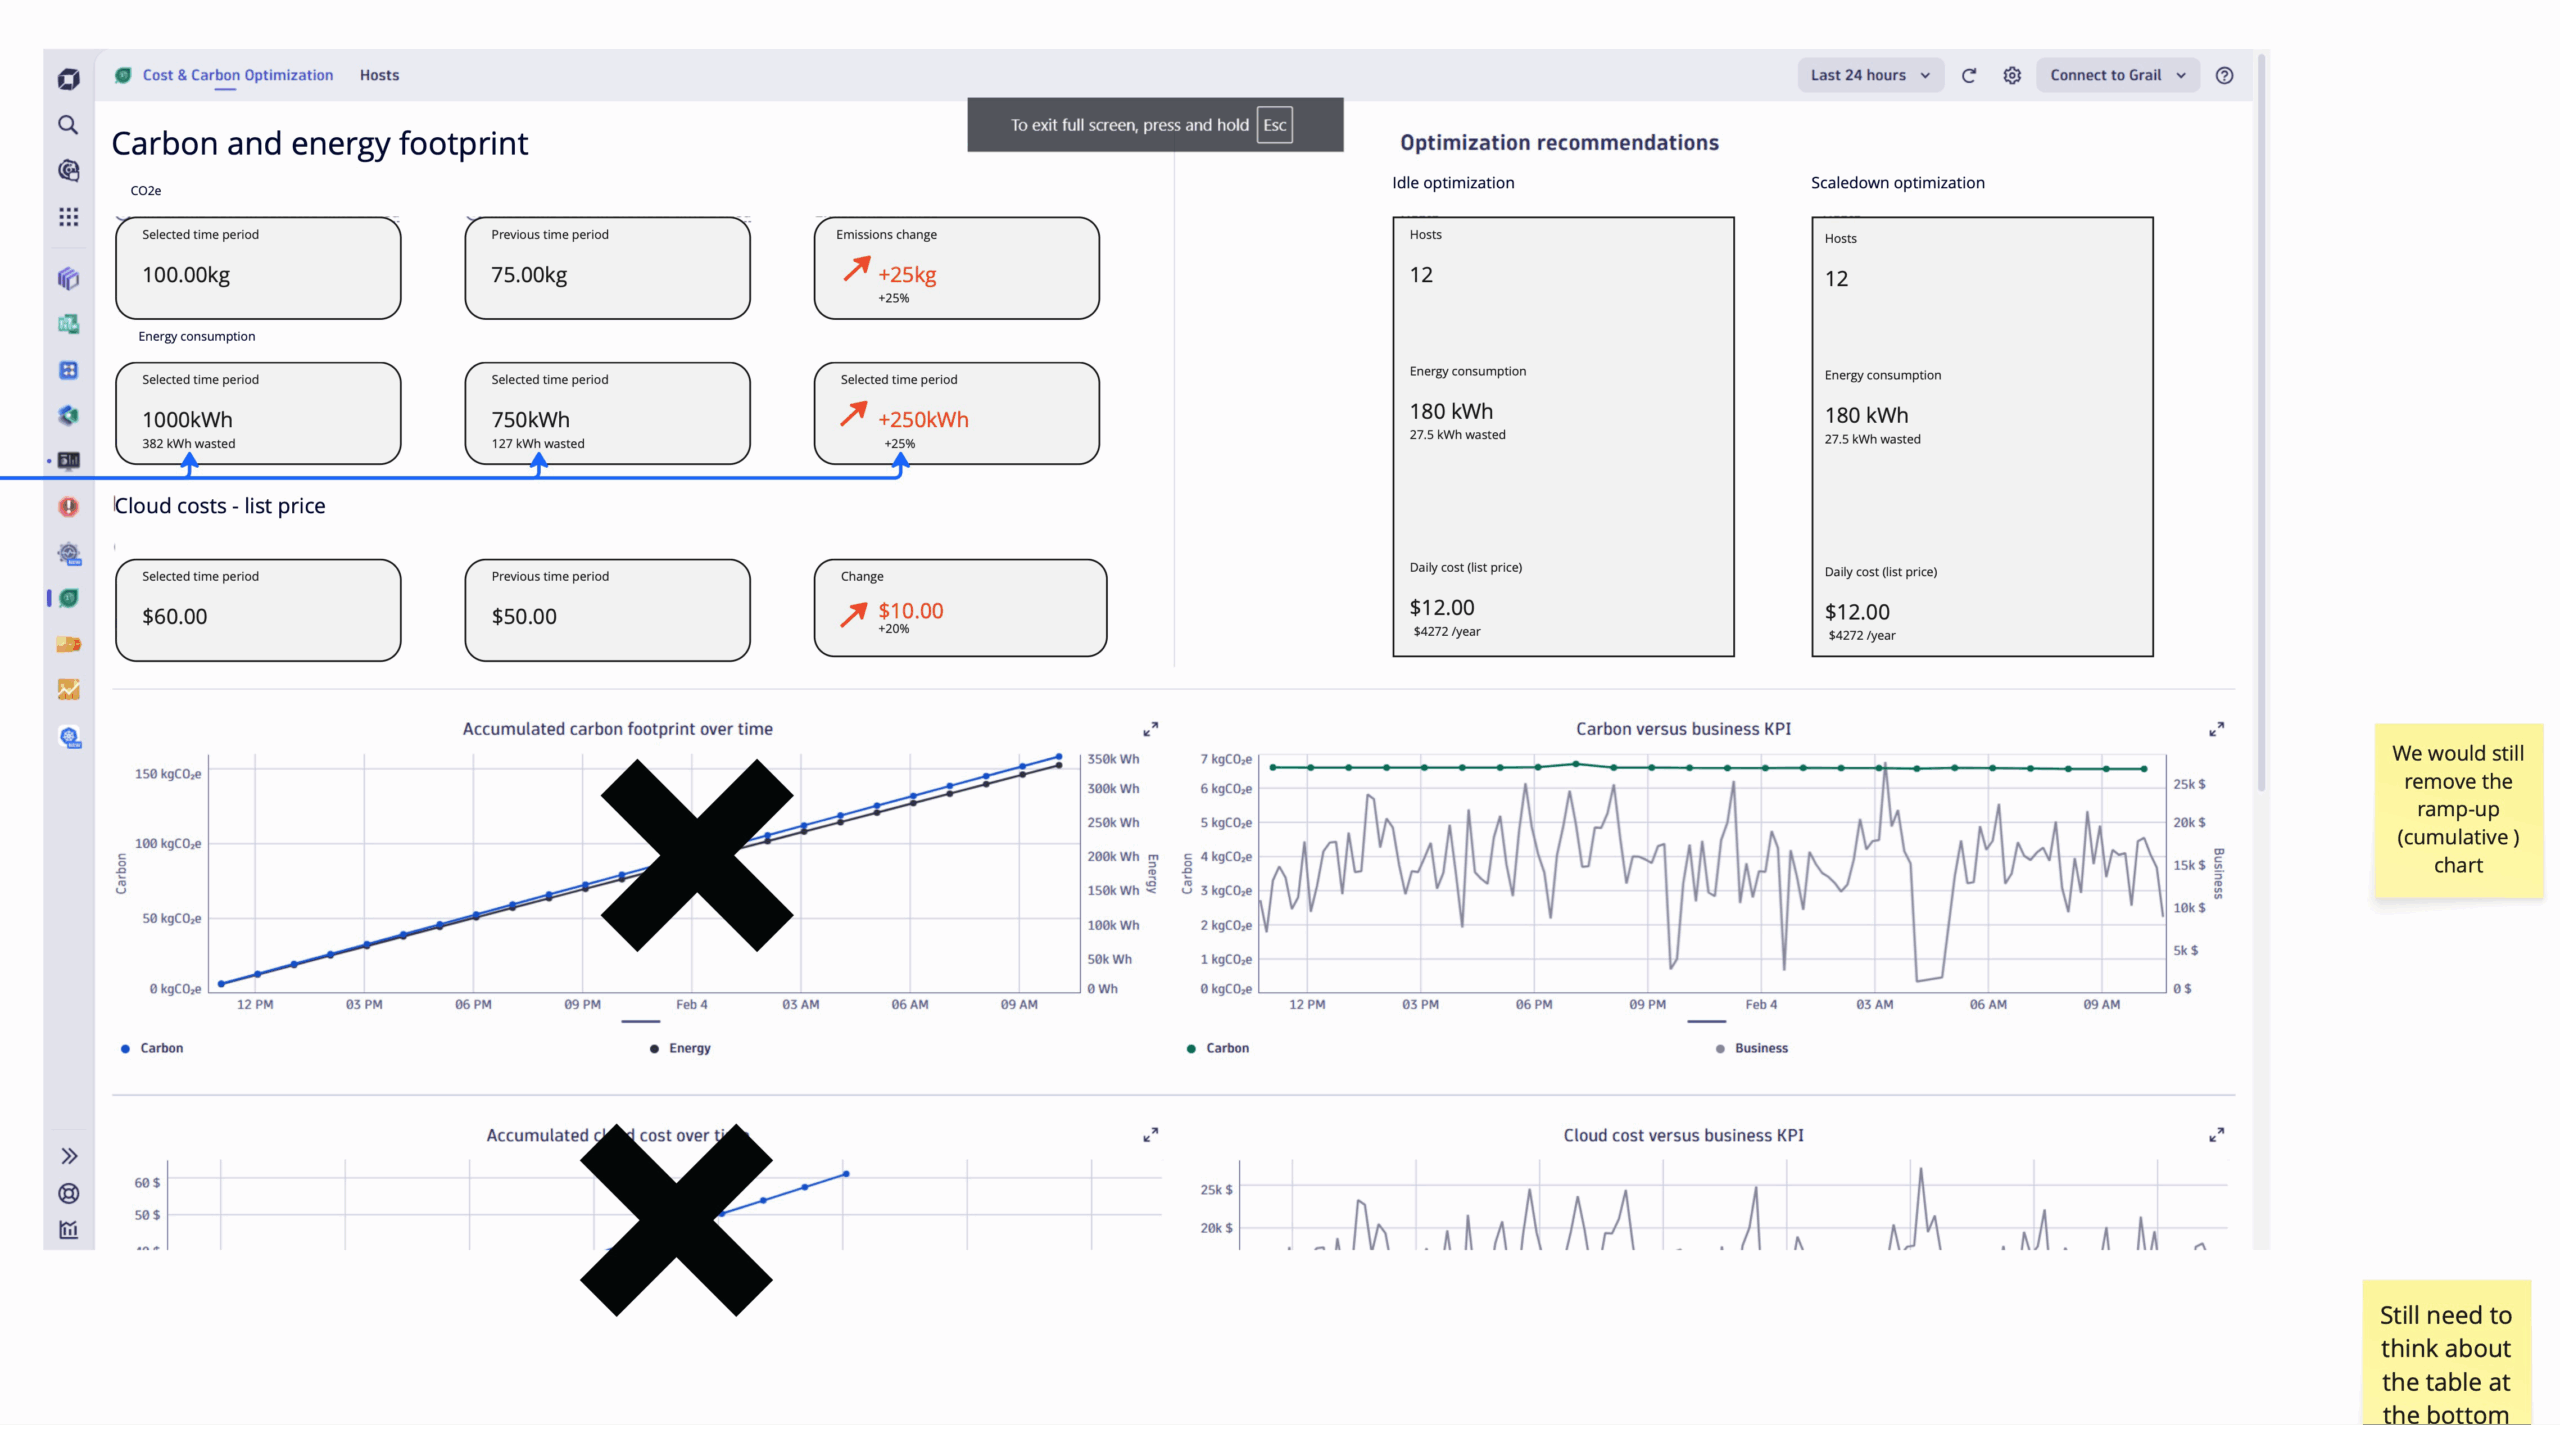
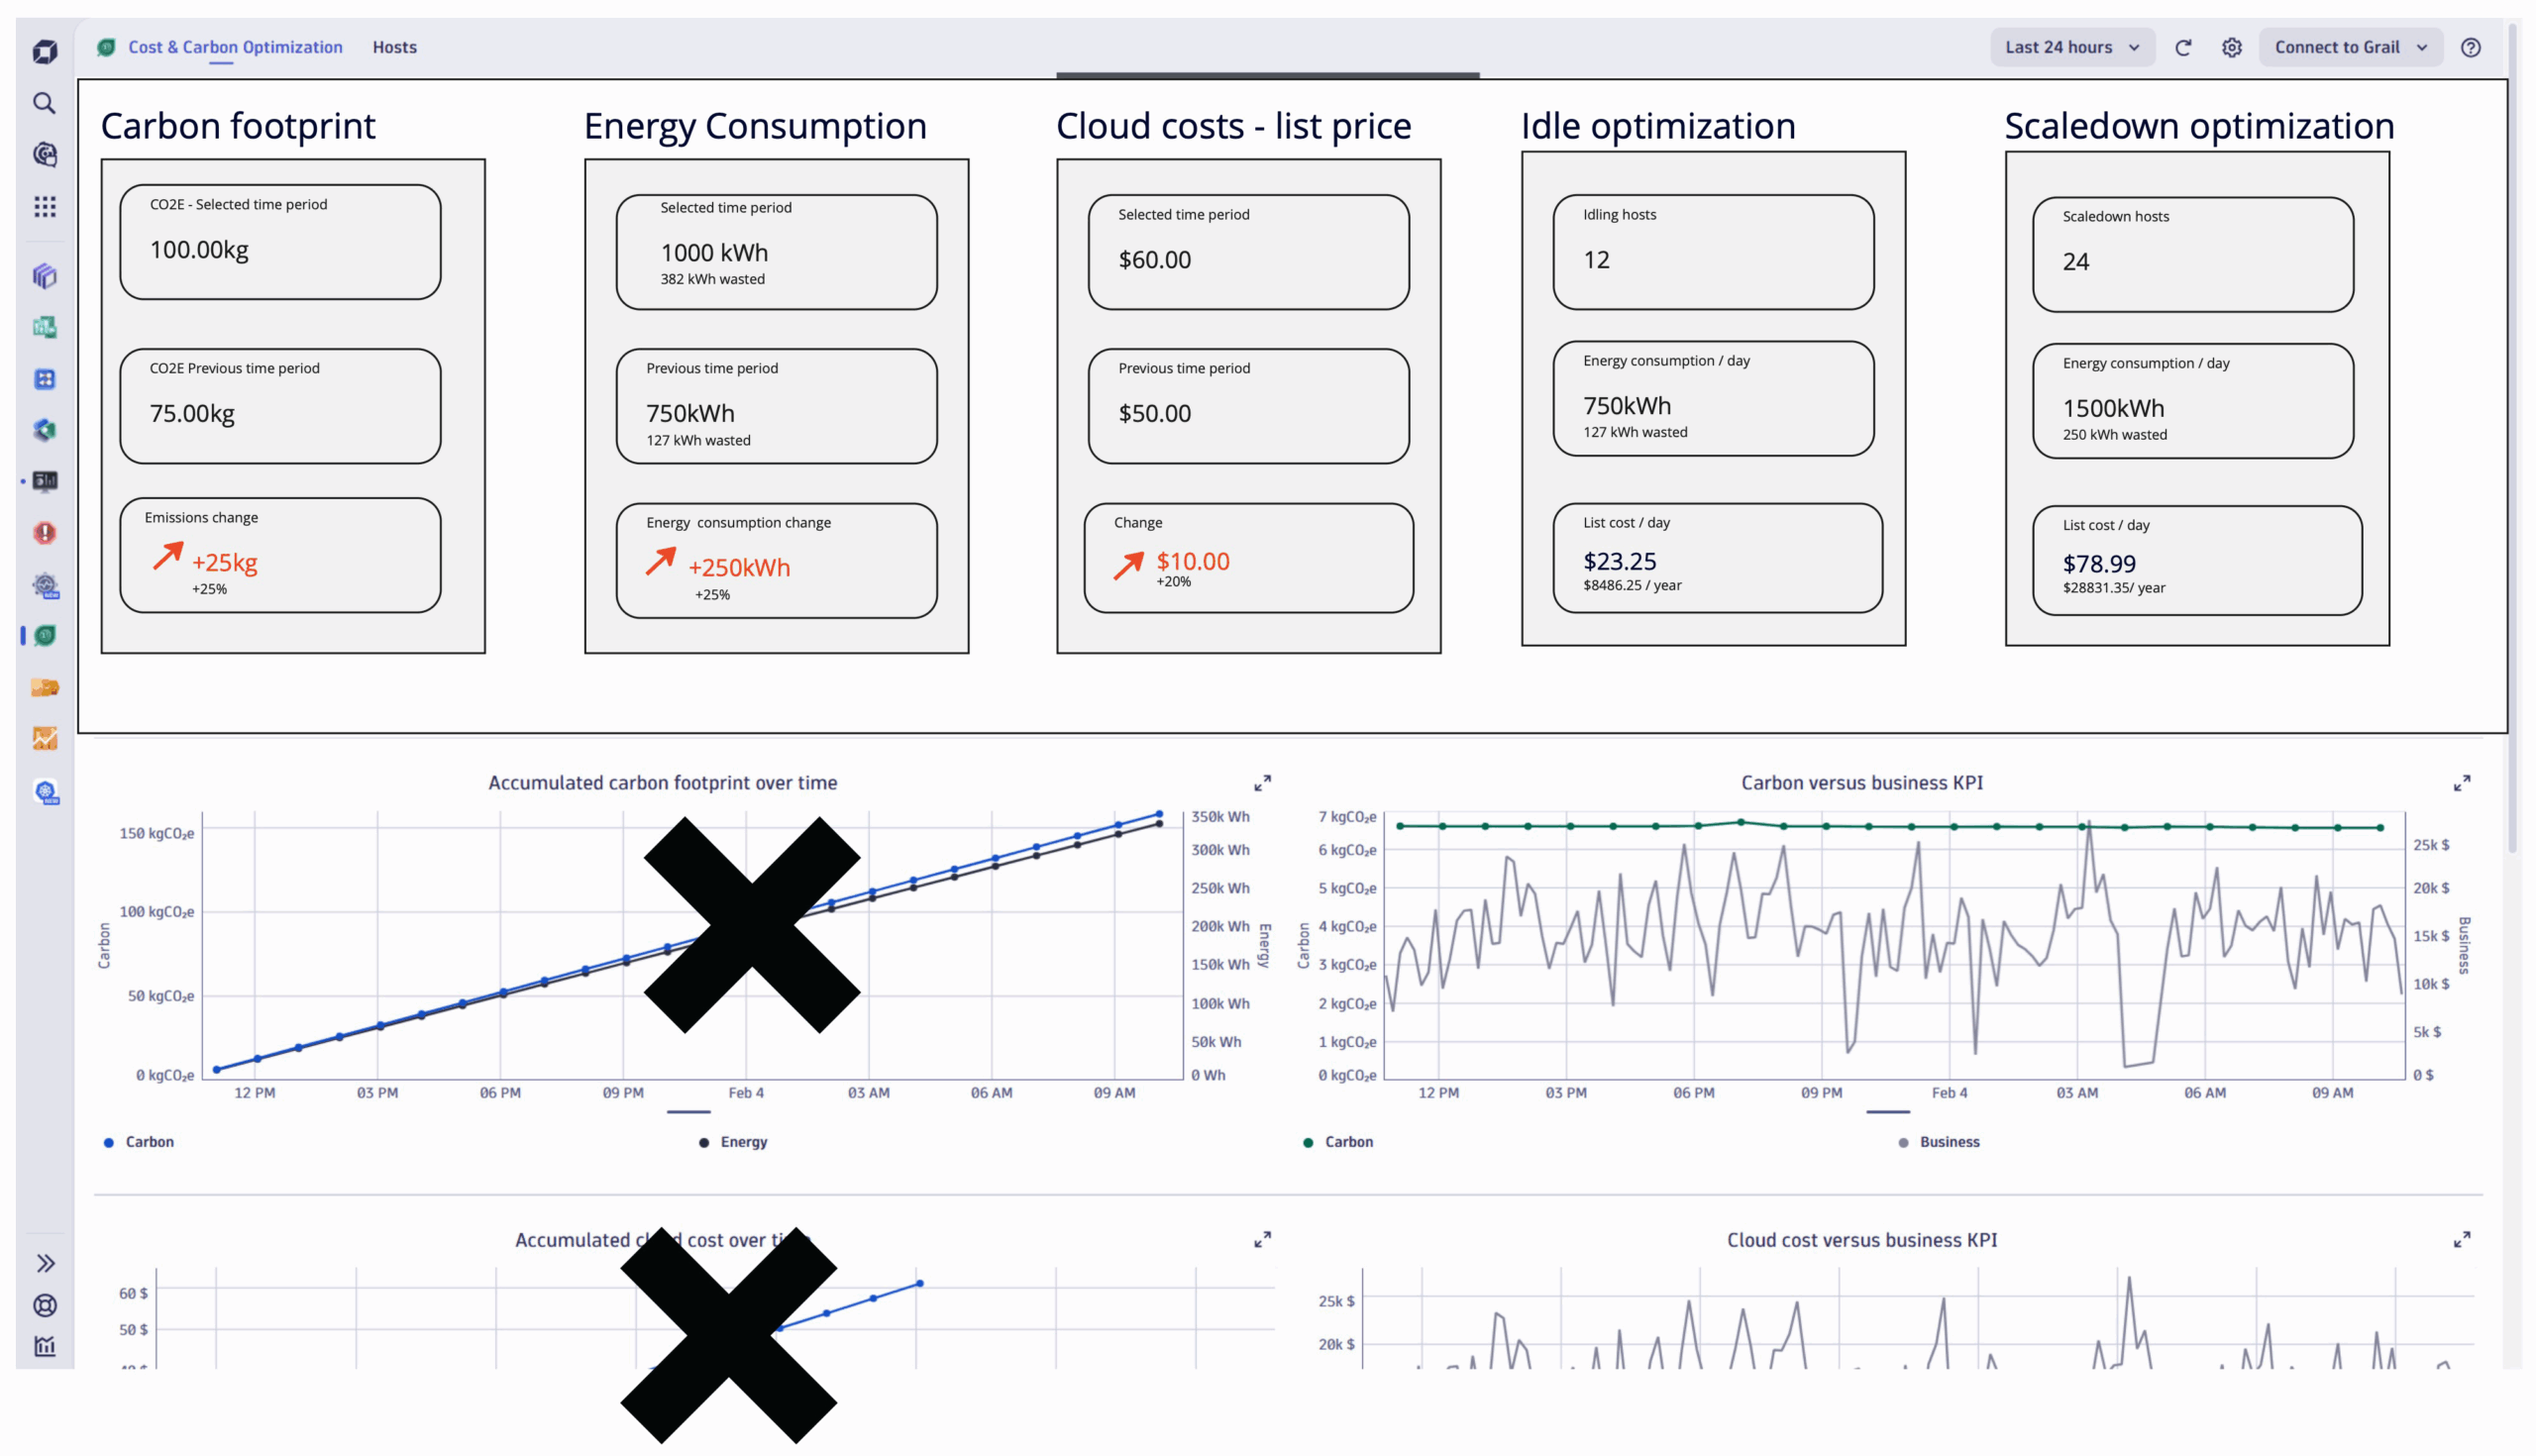
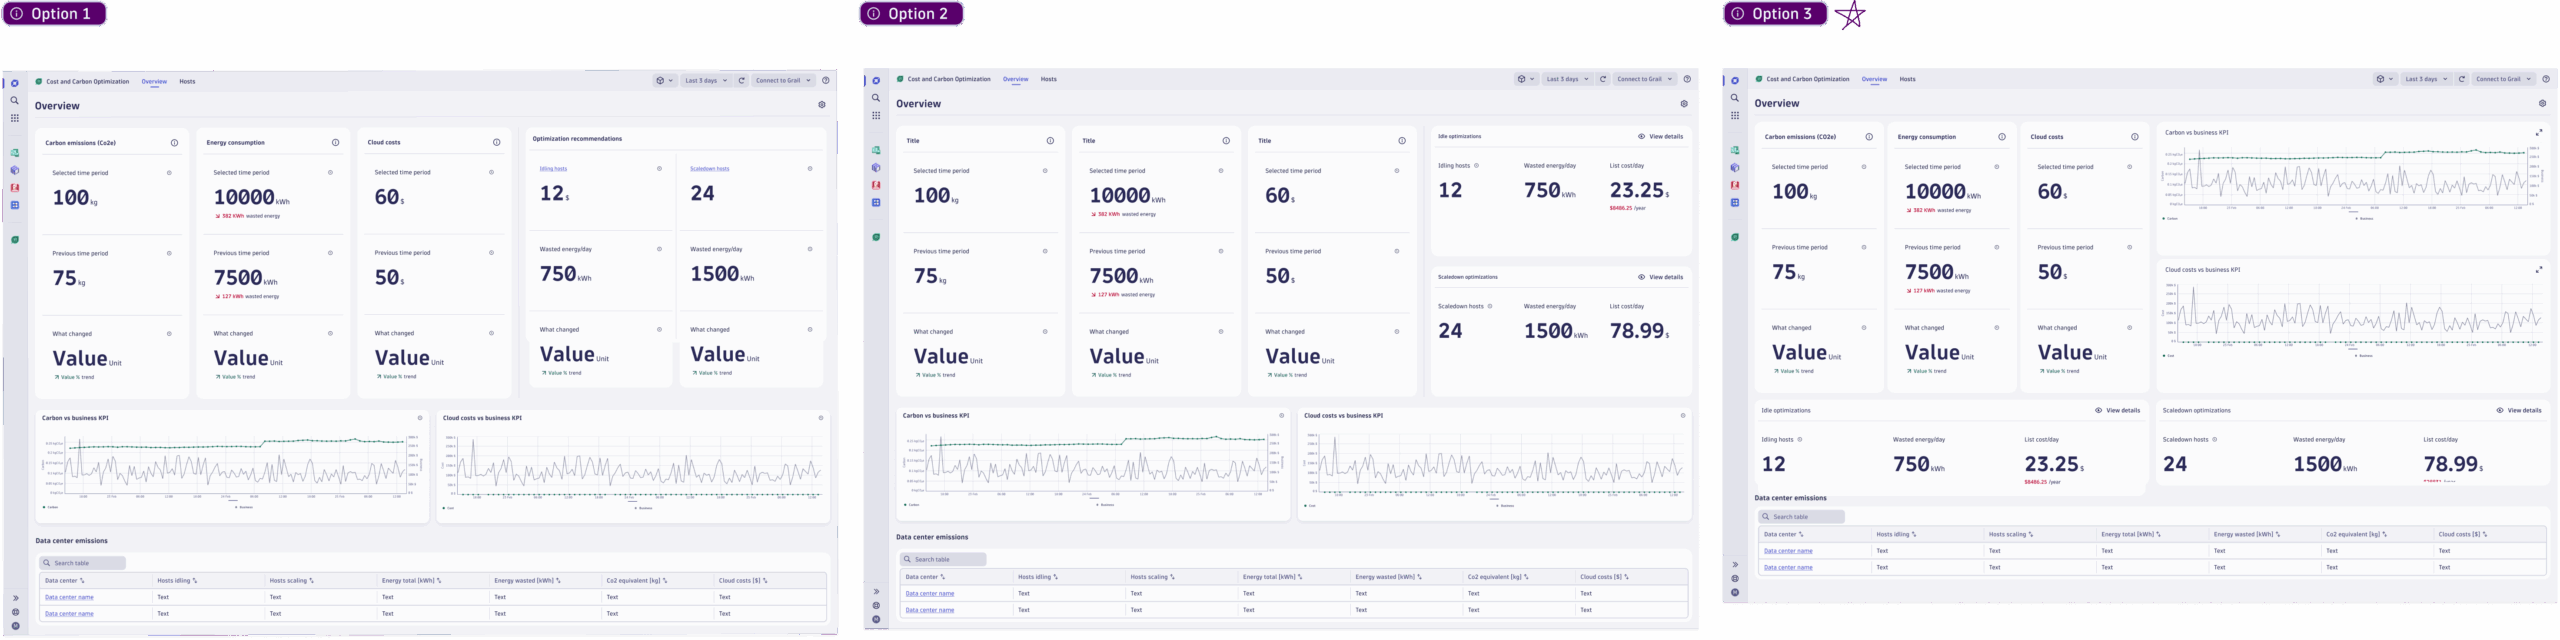
We (PM + I) reframed the product around a future cost explorer experience that marries carbon and cloud-spend analytics. To get to native FinOps capabilities, the app experience needed to flex from price estimates to energy consumption to carbon impact, while aligning with the design system's patterns. Every current design decision ladders up to that vision.


Experience highlights
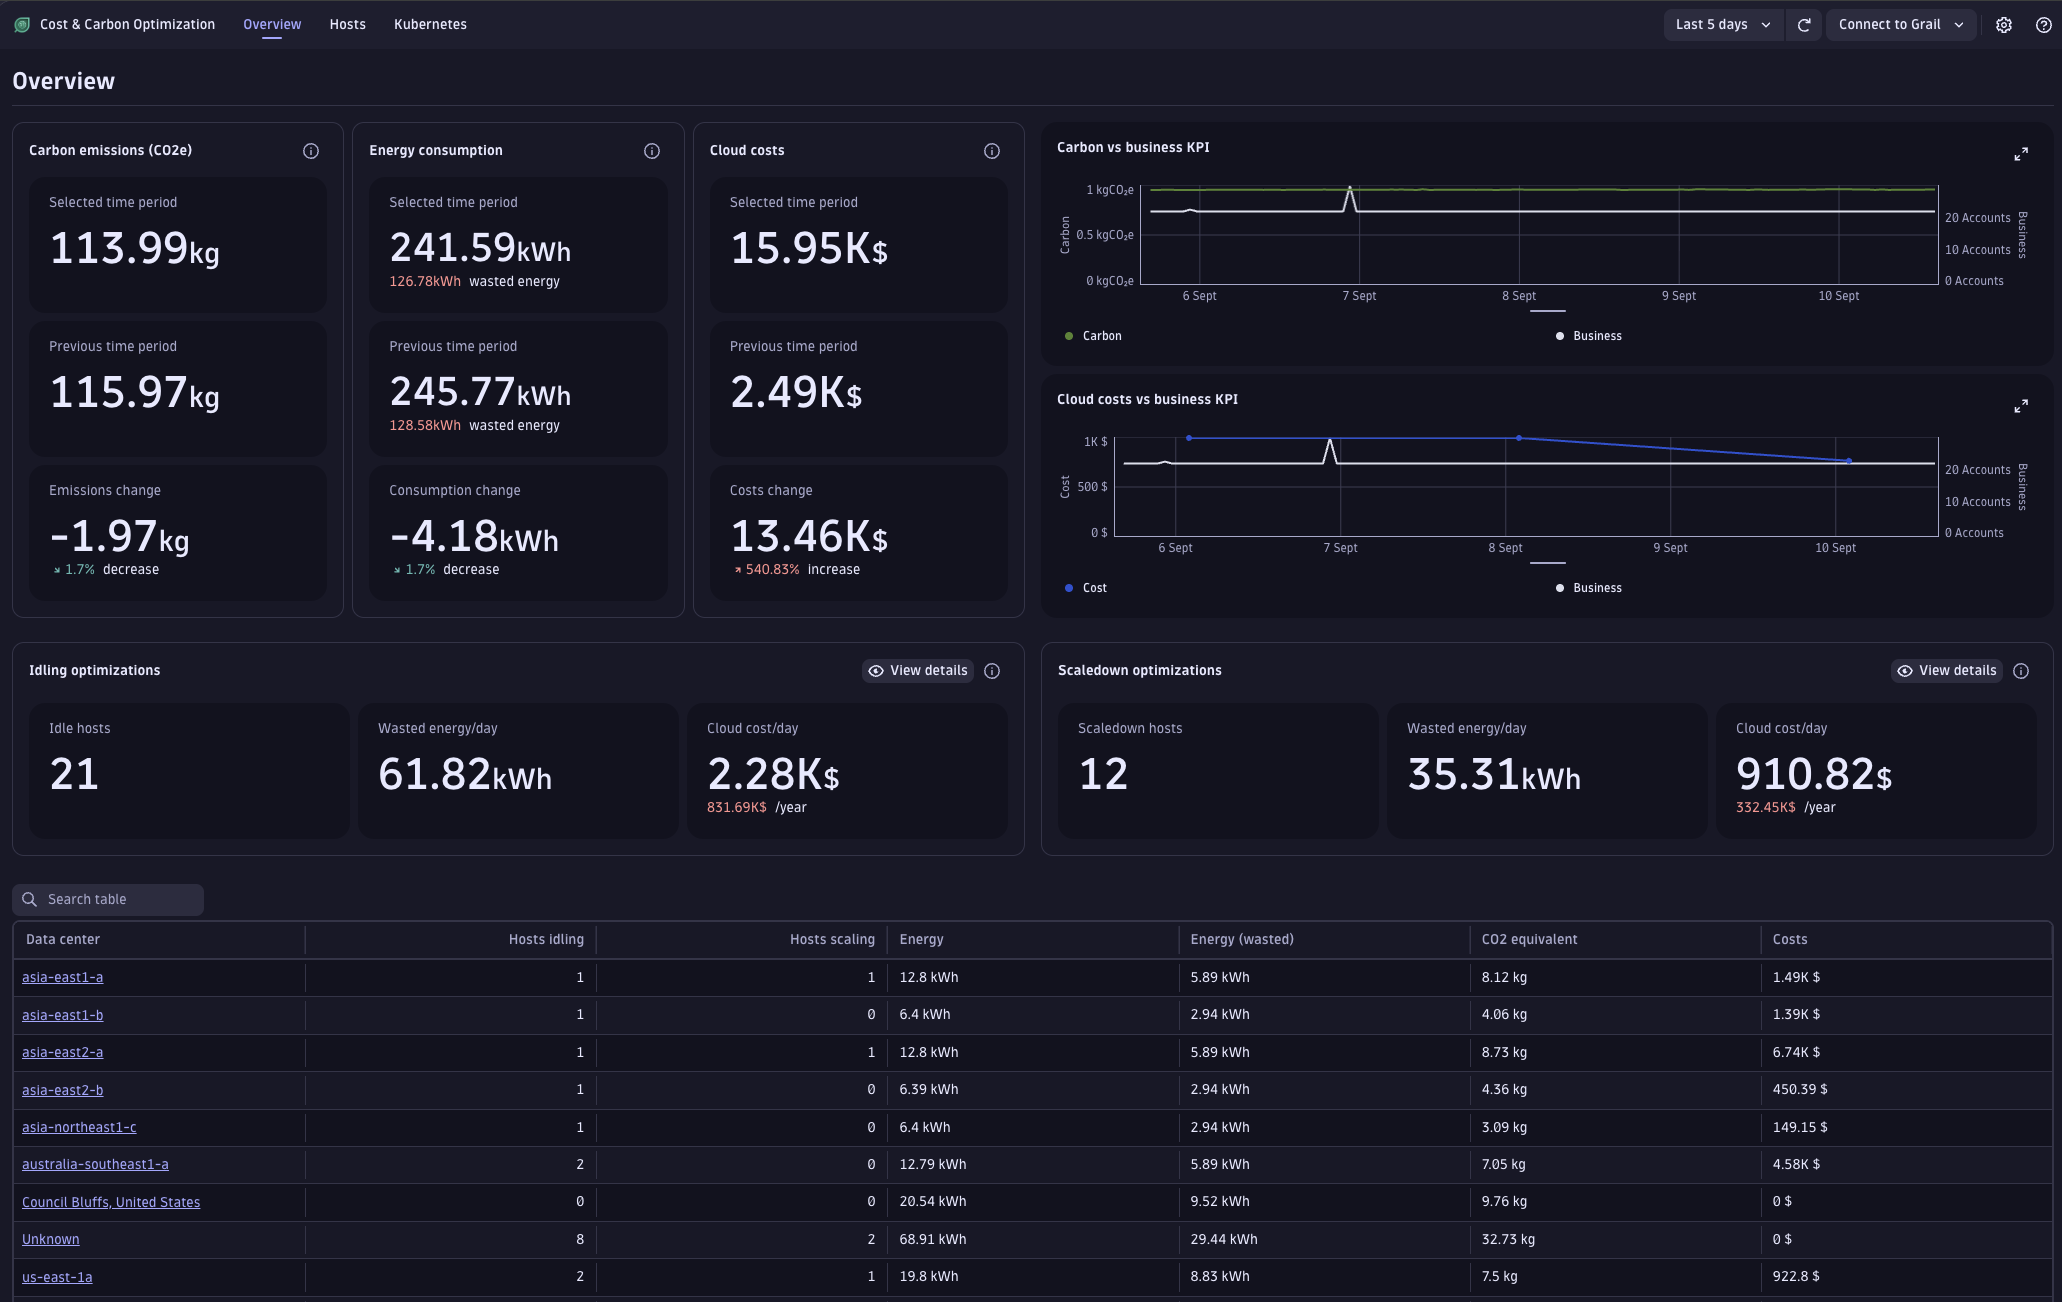
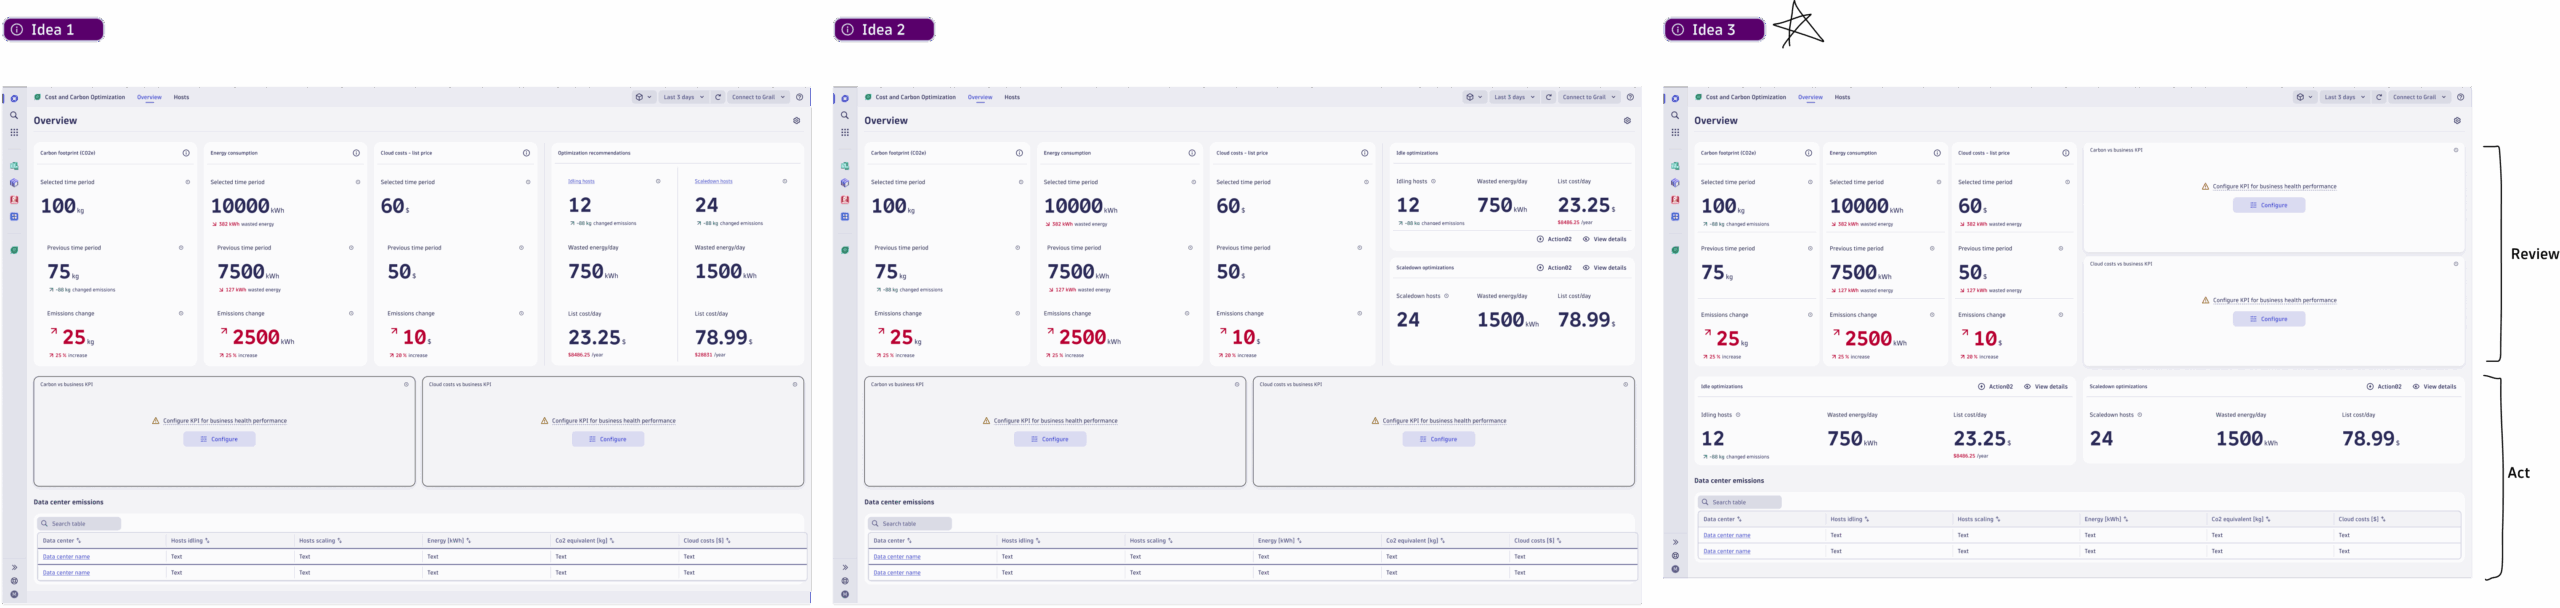
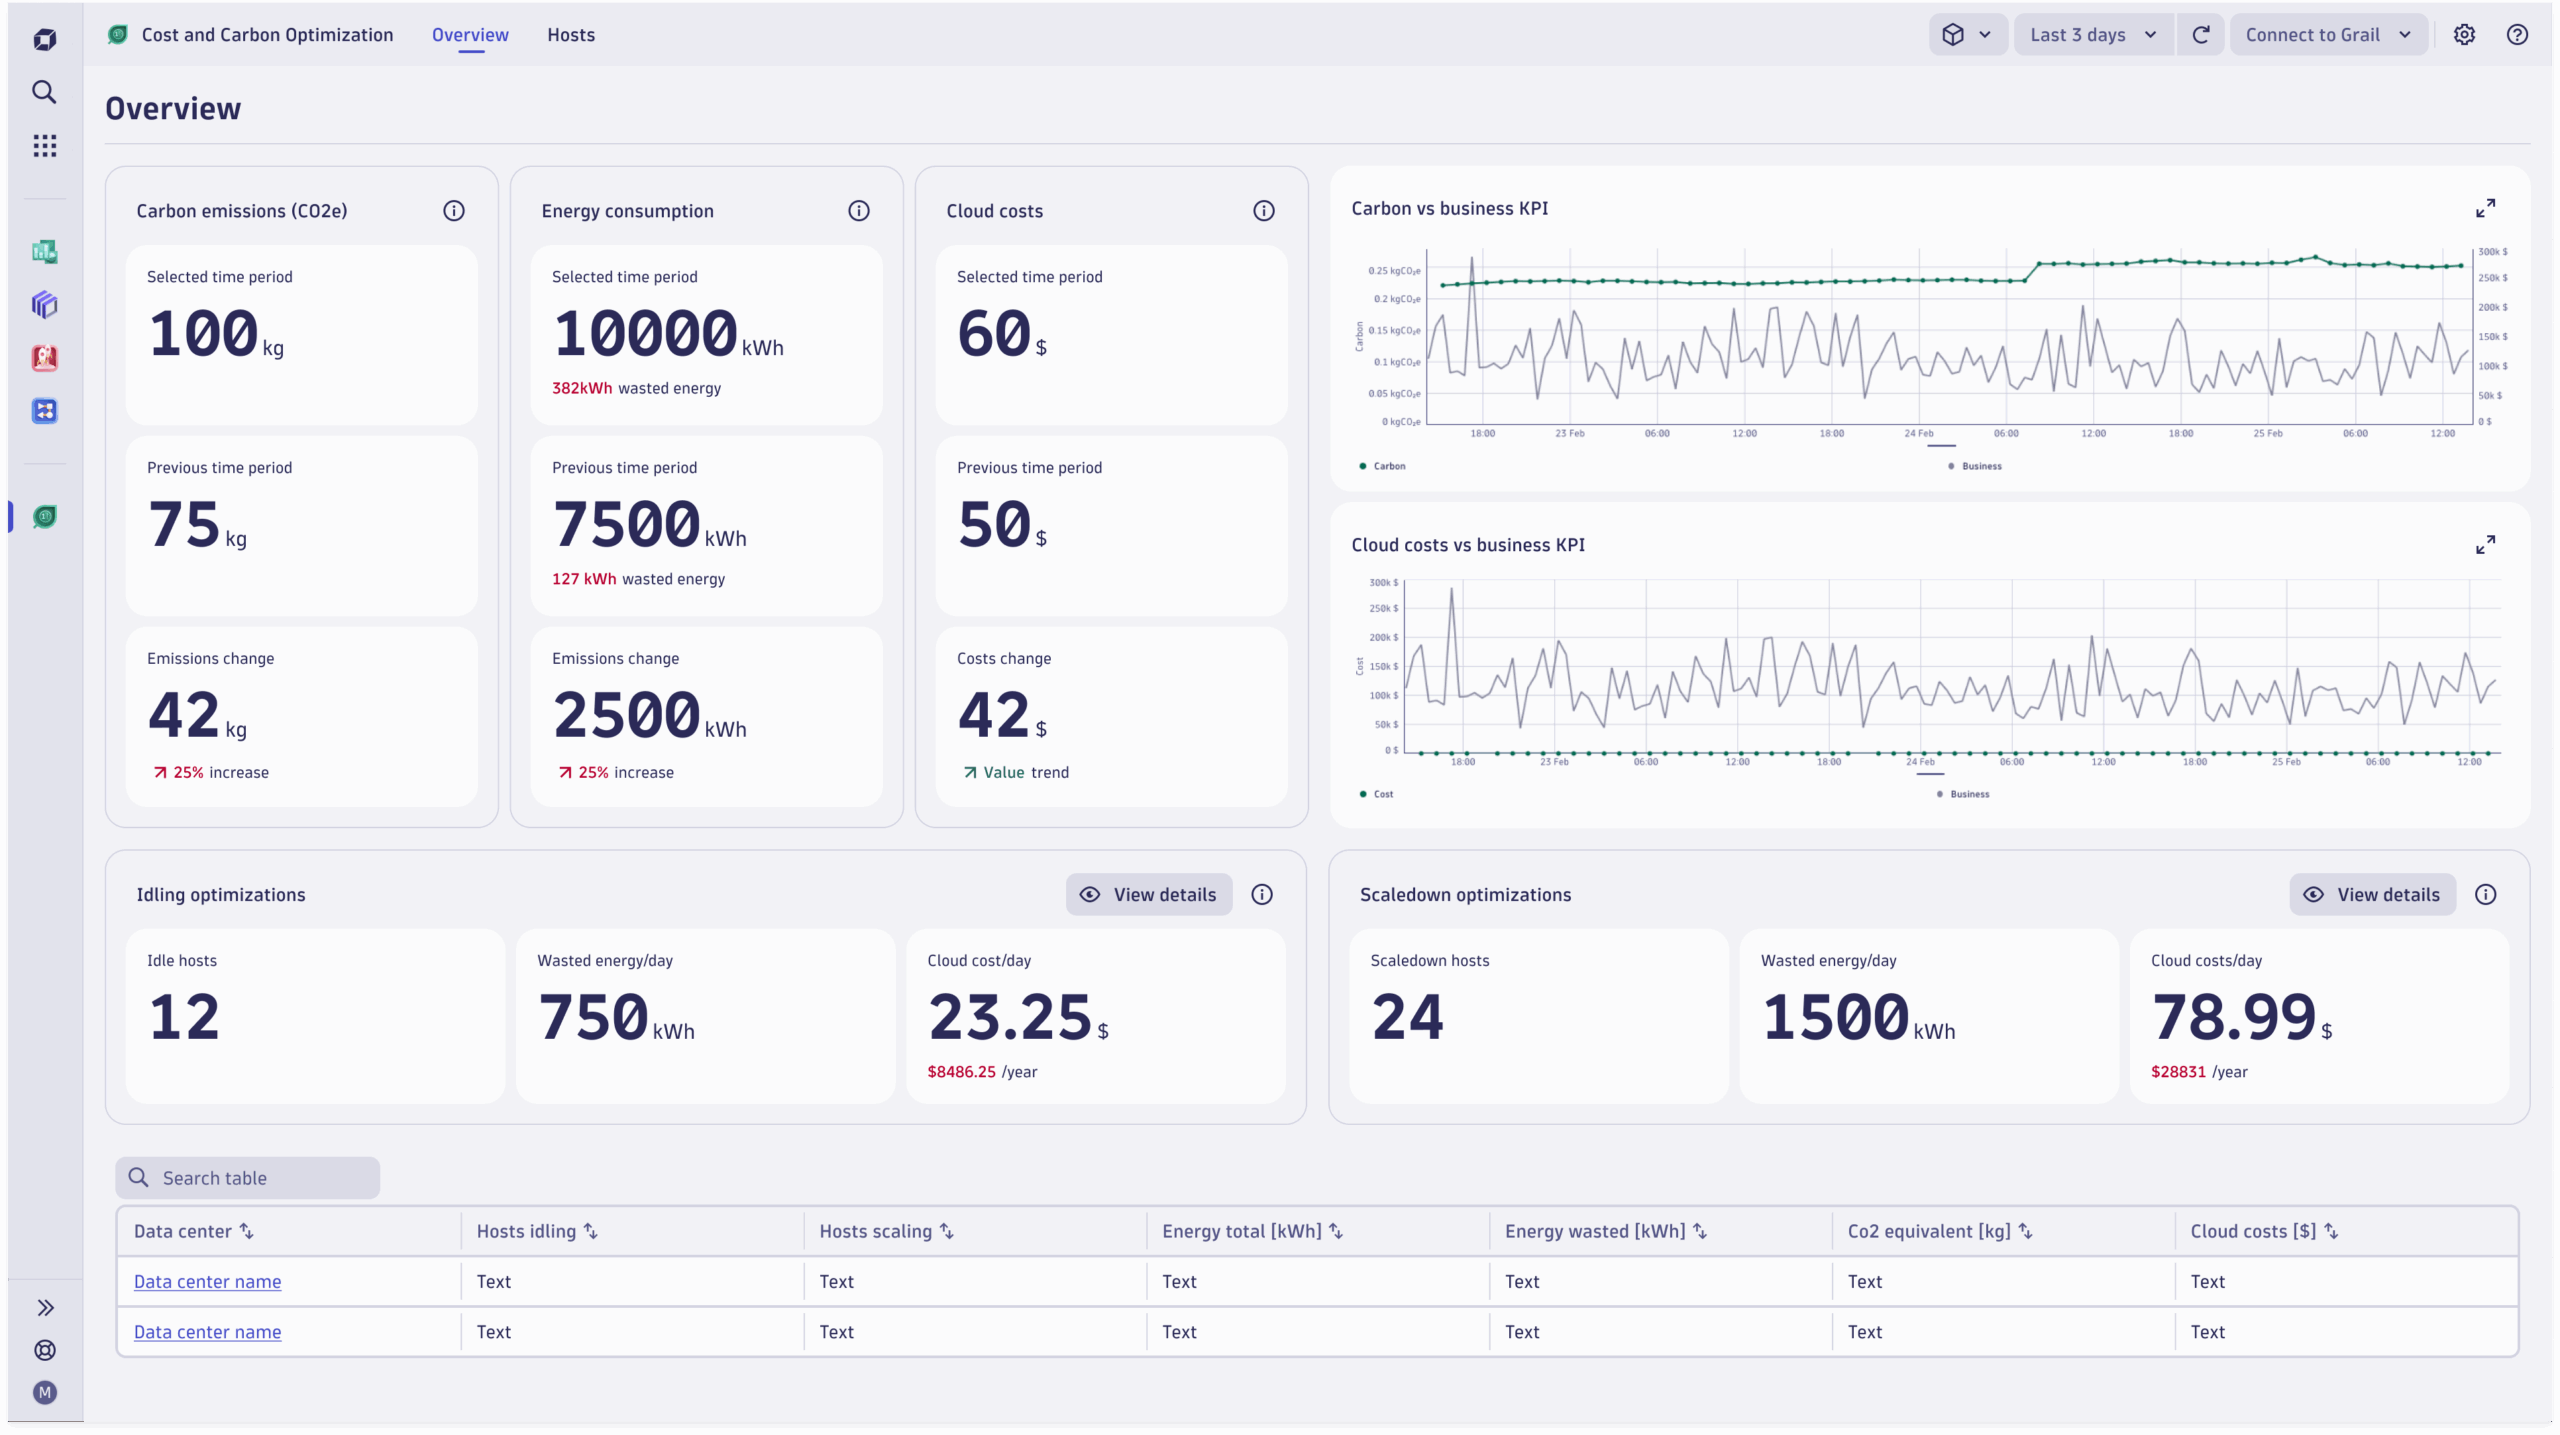
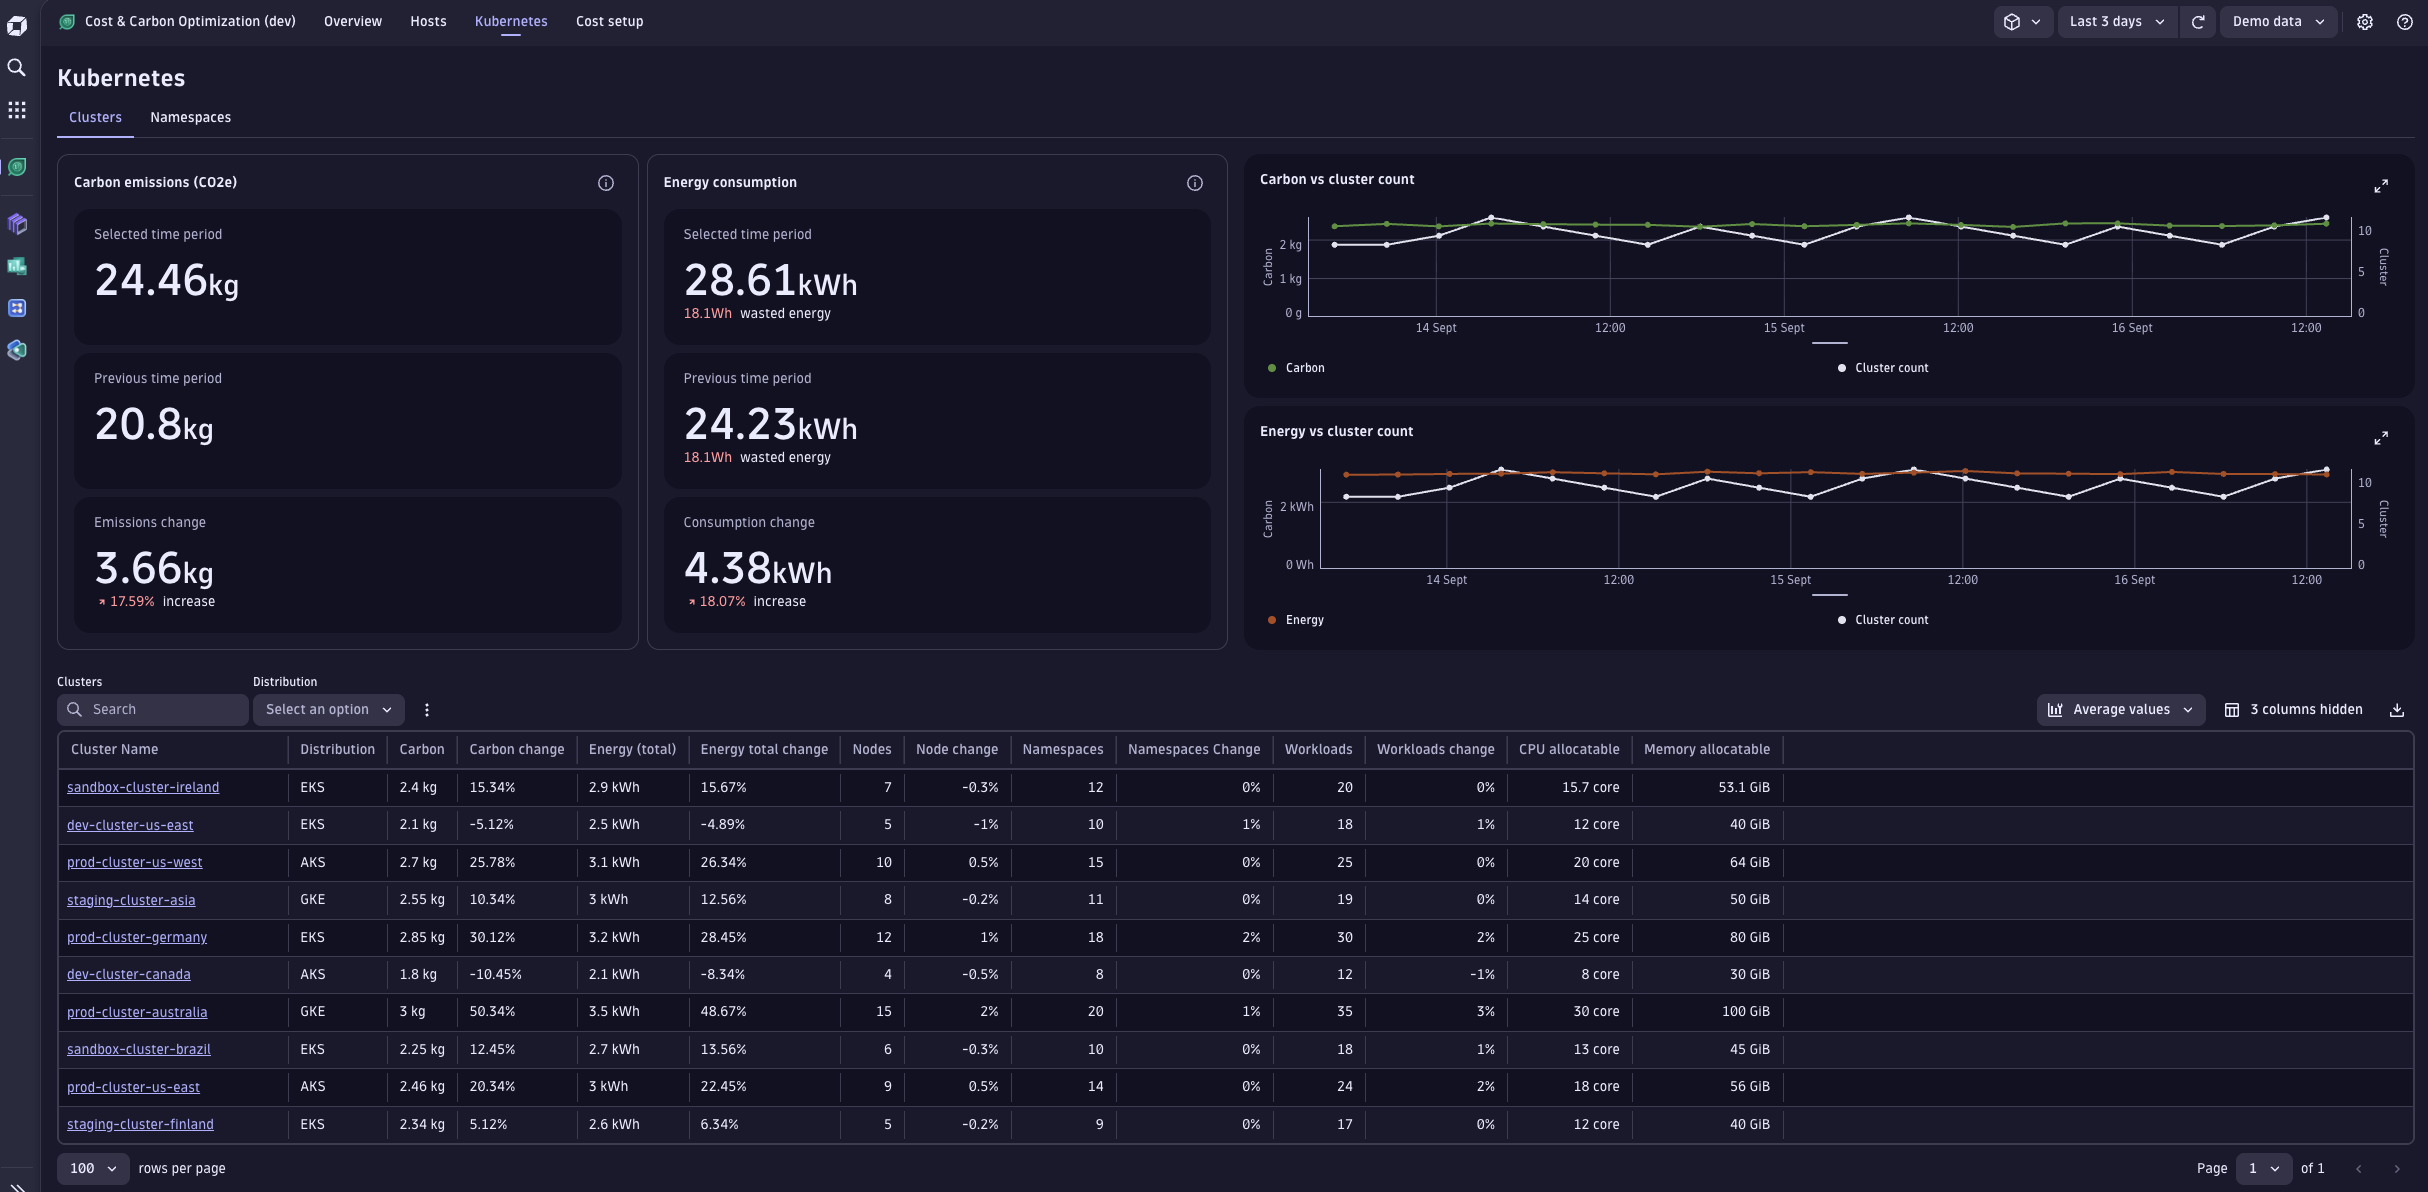
The redesigned overview now pairs carbon and cost KPIs, surfaces wasted energy and savings opportunities instantly, and keeps drill-down cards consistent across hosts, clusters, namespaces, and workloads. "View details" links jump straight into filtered optimization steps, carrying the same design language so users never lose their place. Guided onboarding ensures that the right data pipelines- energy, emissions, pricing- are active before teams dive in.


Metrics
Bizevents ingested= 2.2 M events (Dynatrace earns $ on every event ingest)
"View details" clicks in optimization panels = 36K
- Data-center link drill-downs from the overview page = 18K
- Queries in notebooks apps tied to sustainability entities = 1300 sessions
What's next
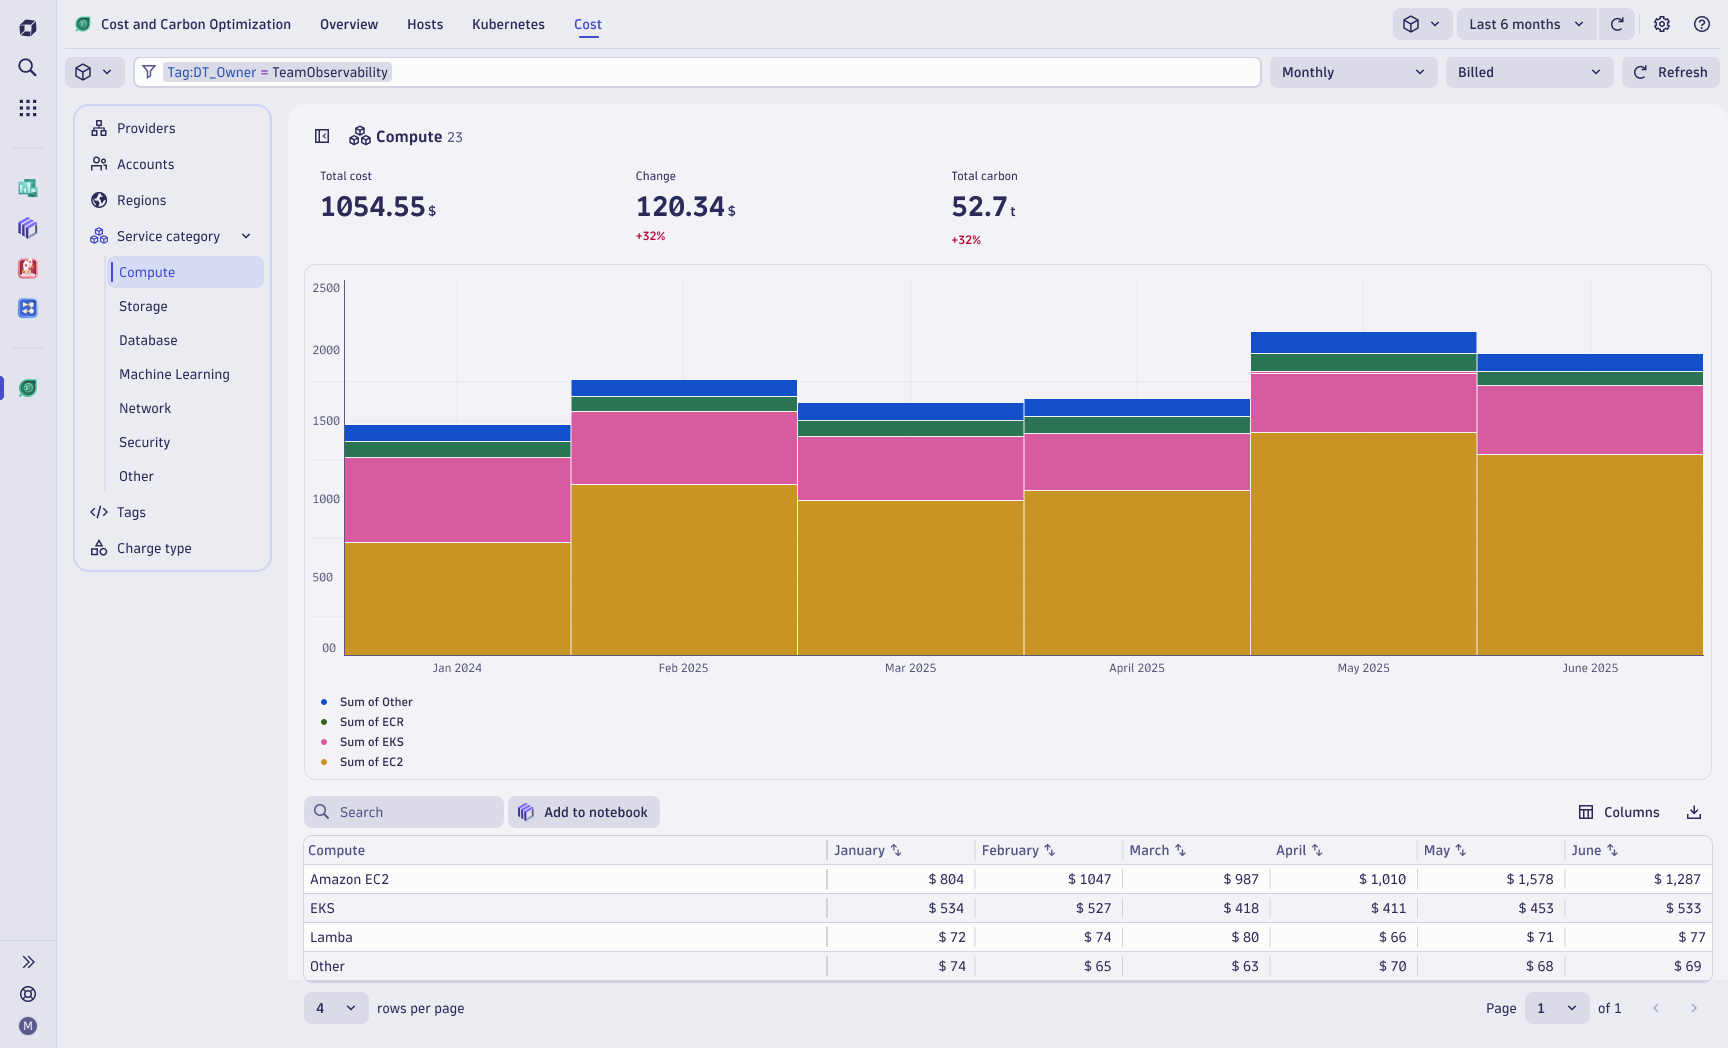
The cost explorer! The app experience will evolve towards balancing FinOps-grade spend analytics with the carbon storytelling our customers rely on today. It's how we keep Dynatrace at the center of both their optimization budgets and their sustainability playbook. Here is a sneakpeak.

_________
Team offsite in the hills of Vienna.
Celebrating with my Business Observability engineering team.